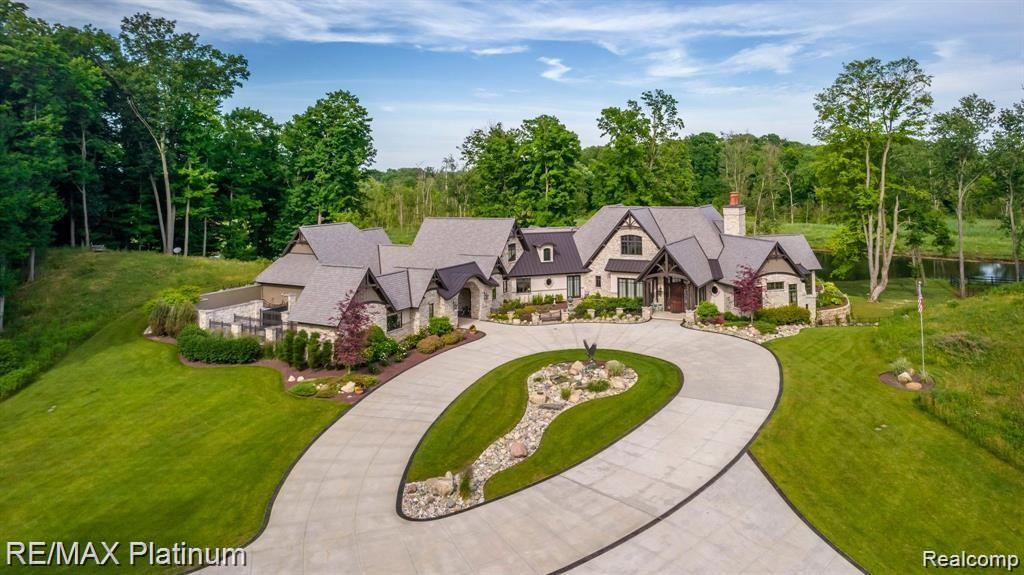
For buyers who want the perfect blend of small-town charm and upscale living, Howell and Fowlerville, Michigan offer a lifestyle that feels both refined and refreshingly authentic. Nestled in Livingston County, these communities provide spacious estates, equestrian properties, and private retreats with the convenience of easy access to Lansing, Ann Arbor, and Metro Detroit.
Dining here combines local flavor with elevated experiences. Howell’s historic downtown features award-winning spots like Diamonds Steak and Seafood and Uptown Coffeehouse, alongside boutique wine bars and cozy bakeries. Seasonal delights shine at the Howell Sunday Farmers Market, where fresh produce, artisanal breads, and handcrafted goods reflect the area’s agricultural roots. In Fowlerville, residents enjoy welcoming taverns, hometown eateries, and quick access to nearby fine dining in Brighton and Novi.
Weekends are filled with leisure and adventure. Residents can enjoy a round of golf at Chemung Hills, spend an afternoon antiquing in Howell’s historic district, or set out for boating and fishing on Thompson Lake and Lake Chemung. Families and couples alike flock to seasonal events like the Howell Melon Festival or the Fowlerville Fair, while nature lovers find peace hiking at the Brighton Recreation Area or cycling the Lakelands Trail. Boutique shopping, community festivals, and private gatherings on sprawling outdoor patios make weekends both lively and serene.
The four seasons bring year-round beauty. Spring awakens the landscape with blossoms and lakefront breezes, summer invites endless days on the water and outdoor entertaining, autumn paints the countryside in brilliant color perfect for wine tastings and fall festivals, and winter transforms the area into a cozy escape with historic homes and elegant holiday charm.
For the discerning buyer, Howell and Fowlerville offer more than a home—they promise a lifestyle of space, comfort, and timeless Michigan beauty.
63,527 people live in Howell / Fowlerville, where the median age is 41.2 and the average individual income is $45,053. Data provided by the U.S. Census Bureau.
Total Population
Median Age
Population Density Population Density This is the number of people per square mile in a neighborhood.
Average individual Income
There's plenty to do around Howell / Fowlerville, including shopping, dining, nightlife, parks, and more. Data provided by Walk Score and Yelp.
Explore popular things to do in the area, including Oh Crumbs Bread, Tony's Dogs, and Griff's Grill.
| Name | Category | Distance | Reviews |
Ratings by
Yelp
|
|---|---|---|---|---|
| Dining | 1.55 miles | 14 reviews | 5/5 stars | |
| Dining | 1.82 miles | 10 reviews | 4.9/5 stars | |
| Dining | 1.8 miles | 19 reviews | 4.9/5 stars | |
| Dining · $ | 3.95 miles | 17 reviews | 4.8/5 stars | |
| Dining · $$ | 3.87 miles | 4 reviews | 5/5 stars | |
| Dining | 3.76 miles | 8 reviews | 4.8/5 stars | |
|
|
||||
|
|
||||
|
|
||||
|
|
||||
|
|
||||
|
|
Howell / Fowlerville has 24,510 households, with an average household size of 5.25. Data provided by the U.S. Census Bureau. Here’s what the people living in Howell / Fowlerville do for work — and how long it takes them to get there. Data provided by the U.S. Census Bureau. 63,527 people call Howell / Fowlerville home. The population density is 434 and the largest age group is Data provided by the U.S. Census Bureau.
Total Population
Population Density Population Density This is the number of people per square mile in a neighborhood.
Median Age
Men vs Women
Population by Age Group
0-9 Years
10-17 Years
18-24 Years
25-64 Years
65-74 Years
75+ Years
Education Level
Total Households
Average Household Size
Average individual Income
Households with Children
With Children:
Without Children:
Marital Status
Blue vs White Collar Workers
Blue Collar:
White Collar: